1] Here is a good example of how to present relative and absolute information:
Blood Pressure Lowering Treatment Trialists' Collaboration, Sundström J, Arima H, Woodward M, Jackson R, Karmali K, Lloyd-Jones D, Baigent C, Emberson J, Rahimi K, MacMahon S, Patel A, Perkovic V, Turnbull F, Neal B.Blood pressure-lowering treatment based on cardiovascular risk: a meta-analysis of individual patient data. Lancet. 2014 Aug 16;384(9943):591-8. PMID: 25131978
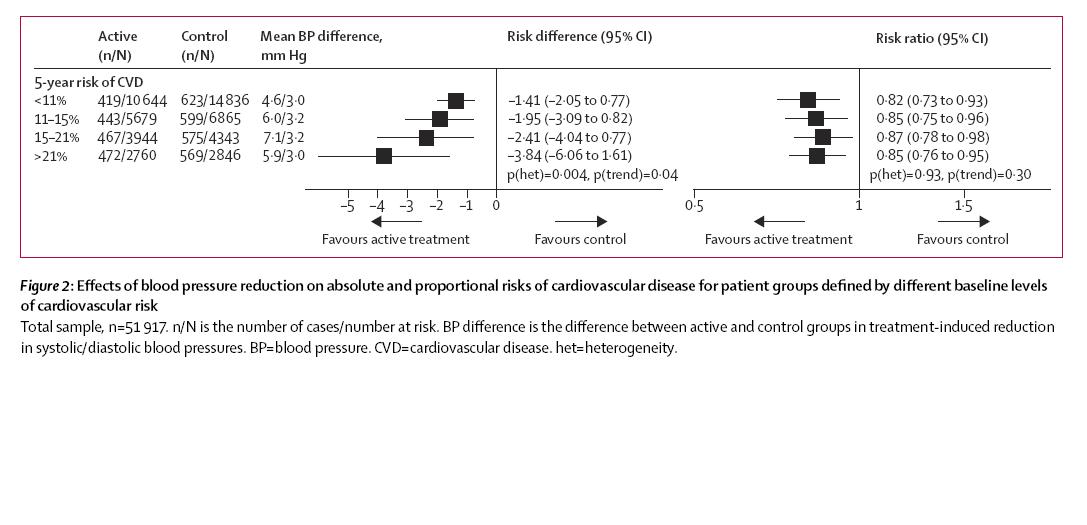
One can readily discern the joint effects pattern in Figure 2 (homogeneity on the ratio scale but EMM on the additive scale). Note the heterogeneity and trend p-values under each column of effect estimates:
Blood Pressure Lowering Treatment Trialists' Collaboration, Sundström J, Arima H, Woodward M, Jackson R, Karmali K, Lloyd-Jones D, Baigent C, Emberson J, Rahimi K, MacMahon S, Patel A, Perkovic V, Turnbull F, Neal B.Blood pressure-lowering treatment based on cardiovascular risk: a meta-analysis of individual patient data. Lancet. 2014 Aug 16;384(9943):591-8. PMID: 25131978
One can readily discern the joint effects pattern in Figure 2 (homogeneity on the ratio scale but EMM on the additive scale). Note the heterogeneity and trend p-values under each column of effect estimates: